Science
The Loudest Room in the House
Measure every room with a phone sound meter, find the loudest one, then build a quiet box from household materials and measure exactly how many decibels each layer buys you.
Medium · 2 hours
Introduction
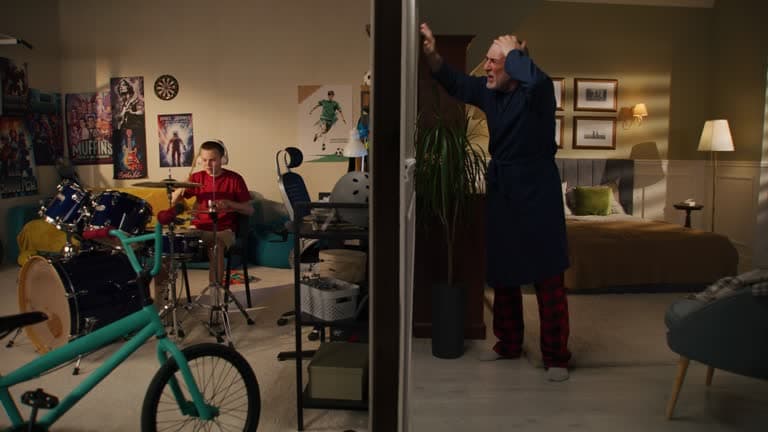
Everybody in your house already has an opinion about which room is loudest. Almost nobody has measured it.
A free sound meter app turns a phone into a real instrument. Once you can put a number on the noise, arguments turn into measurements, and you can start engineering toward a target instead of toward a feeling.
The Why
Decibels do not add up the way ordinary numbers do. The scale is logarithmic, so every 10 decibels is roughly a doubling of how loud something seems, which means taking 10 dB off a sound is a much bigger win than the number makes it look. Measuring the same source from the same distance every single time is what makes your readings comparable, and it is the only reason you can claim it was the towel layer, and not the room, that made the difference.
Step-by-Step Instructions
- 1
Install a sound meter app with an adult and learn to read it. Most report decibels, written dB, and the number jumps around constantly, so take the middle of the range rather than the highest spike.
- 2
Map the background level of every room with nothing running: hold the phone at chest height in the middle of the room, wait ten seconds, and write the number down. That is your baseline.
- 3
Now find the loudest room during normal life, with the television on, the dishwasher running, and everybody talking. Same height, same middle of the room, same ten seconds.
- 4
Set up a repeatable test. Put your steady sound source on the floor, mark a spot exactly one meter away, and measure from that mark every time. Record the bare reading with no box at all.
- 5
Put the sound source inside the empty cardboard box and measure again from the same mark. Write down the drop in decibels.
- 6
Add one material at a time: a towel layer, then egg carton, then crumpled newspaper. Measure after every single layer, and never add two materials in the same round.
- 7
Chart decibels against the number of layers. Find the layer that bought the biggest drop for the least bulk, and write down why you think it won.
Decibel Log
Same spot, same distance, same source, every time. Write down the middle of the range, not the highest spike.
| Test | What changed | Reading 1 (dB) | Reading 2 (dB) | Reading 3 (dB) | Average |
|---|---|---|---|---|---|
| Row 1, Test | Row 1, What changed | Row 1, Reading 1 (dB) | Row 1, Reading 2 (dB) | Row 1, Reading 3 (dB) | Row 1, Average |
| Row 2, Test | Row 2, What changed | Row 2, Reading 1 (dB) | Row 2, Reading 2 (dB) | Row 2, Reading 3 (dB) | Row 2, Average |
| Row 3, Test | Row 3, What changed | Row 3, Reading 1 (dB) | Row 3, Reading 2 (dB) | Row 3, Reading 3 (dB) | Row 3, Average |
| Row 4, Test | Row 4, What changed | Row 4, Reading 1 (dB) | Row 4, Reading 2 (dB) | Row 4, Reading 3 (dB) | Row 4, Average |
| Row 5, Test | Row 5, What changed | Row 5, Reading 1 (dB) | Row 5, Reading 2 (dB) | Row 5, Reading 3 (dB) | Row 5, Average |
| Row 6, Test | Row 6, What changed | Row 6, Reading 1 (dB) | Row 6, Reading 2 (dB) | Row 6, Reading 3 (dB) | Row 6, Average |
| Row 7, Test | Row 7, What changed | Row 7, Reading 1 (dB) | Row 7, Reading 2 (dB) | Row 7, Reading 3 (dB) | Row 7, Average |
| Row 8, Test | Row 8, What changed | Row 8, Reading 1 (dB) | Row 8, Reading 2 (dB) | Row 8, Reading 3 (dB) | Row 8, Average |
Three readings per test, because a sound meter never gives the same number twice. If your three readings are far apart, something moved: check the distance before you trust the average.